COVID OPS - the effects of comorbidity


In simulating the behavior of the virus, one of the datasets that really struck me was the prevalence and effects of "comorbidity". As the "co" in comorbidity indicates, the data usually specific to the additional malady, so coming up with any kind of reasonable number took some doing.
Figuring in the usual suspects (diabetes, hypertension, immunodeficiency, heart disease), I came up with the these numbers for the chance of an infected person having at least one comorbidity:
If peep[x].age > 30 then riskfactor = 5%
If peep[x].age > 40 then riskfactor = 10%
If peep[x].age > 50 then riskfactor = 25%
If peep[x].age > 60 then riskfactor = 40%
That seems rather grim, but most of the charts I found looked very much like the one below. One could say I was kinder than the actual data is.

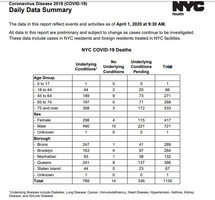
In COVID OPS, you'll find the older folks tend to die a good bit sooner/faster. Next weeks' update will make day's longer so that it will be easier to inspect/monitor daily changes. Two of the data sets I have been looking at are the numbers coming out of New York City and Atlanta. The recent data from NYC below shows the stark difference in number of deaths between people with underlying conditions and people without.

In an average run through of COVID OPS, it may seem like the sim/game is unfairly picking on the elderly and folks with comorbidities. It is attempting to mirror real world data as best it can. Currently, the data shows those are the folks we need to focus on isolating and protecting the most in order to reduce the number of deaths.
Separate. Isolate. Survive.
Related links:
NYC Dept of Health data - https://www1.nyc.gov/site/doh/covid/covid-19-data.page
Georgia Dept of Health data - https://dph.georgia.gov/covid-19-daily-status-report ("Underlying" field in the deaths chart indicates underlying conditions)
COVID OPS
Separate. Isolate. Survive.
| Status | Released |
| Author | LynxJSA |
| Genre | Simulation, Educational |
| Tags | agk, coronavirus, covid-19, virus |
More posts
- In the Time of Pandemia - another Raph-based simApr 19, 2020
- COVID OPS - Update 1.5 - refining the simApr 06, 2020
- Update 1.1 for Covid Ops now published.Apr 02, 2020
- COVID OPS - a coronavirus simulation gameMar 30, 2020
Leave a comment
Log in with itch.io to leave a comment.